
Visual knowledge & live data
NAHRIM Infographics
Explore visual water knowledge and interactive statistics from the National Water Research Institute of Malaysia.
Browse collection
Water knowledge at a glance
 Visual infographic
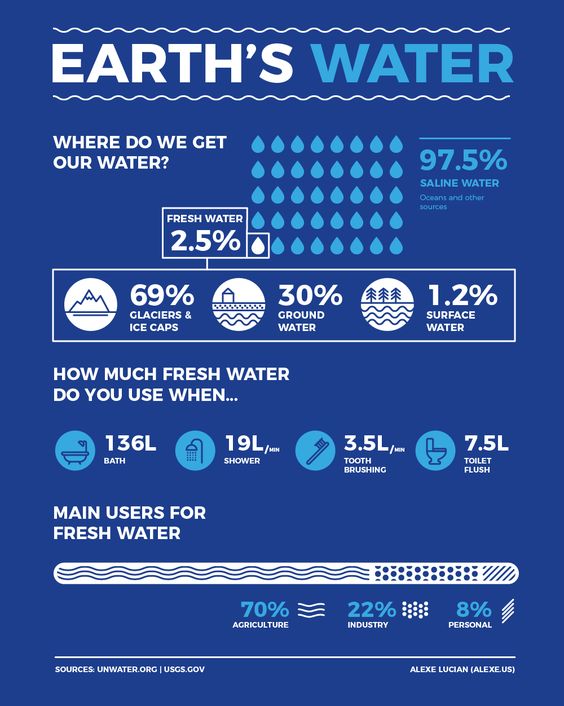
Where do we get our water?
A visual guide to Earth's water distribution and the small proportion available as usable fresh water.
View infographic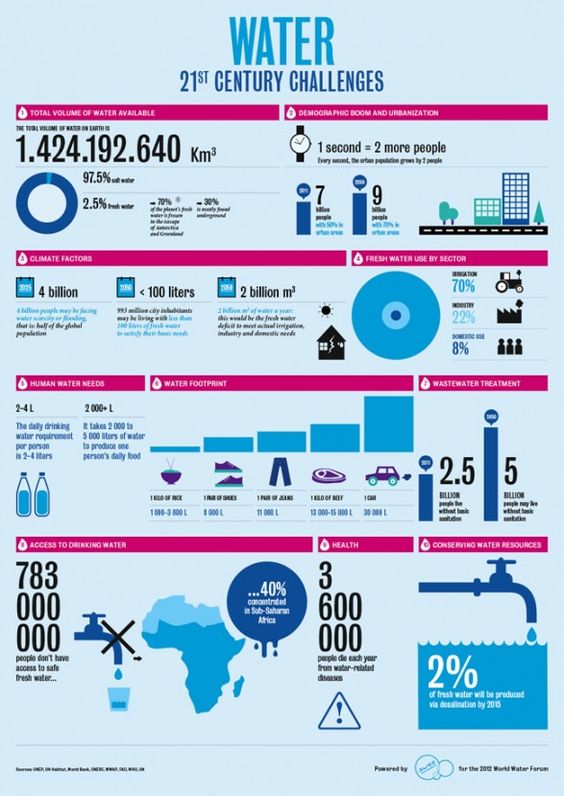 Visual infographic
21st century water challenges
Key global figures on water demand, availability, climate pressure and urban water challenges.
View infographic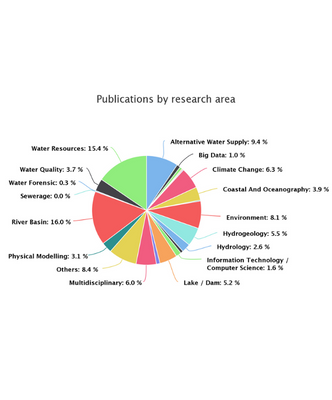 Live dashboard
Statistics publications by research area
Explore publication output across NAHRIM research areas using current public records.
Open dashboard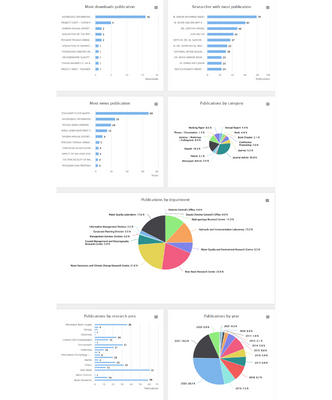 Live dashboard
Dashboard statistics related to publications
Interactive publication statistics by year, category, research area, department and engagement.
Open dashboard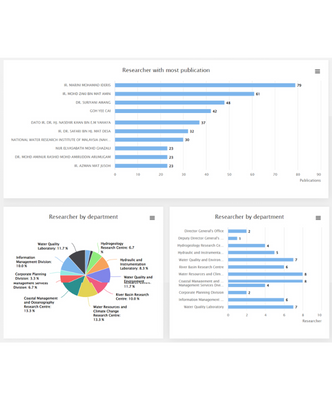 Live dashboard
Dashboard statistics related to researcher
Interactive statistics for active researchers, departments and distinct publication contributions.
Open dashboard